The Penn Supplier Diversity & Inclusion Program has had significant impact on the economy of the Philadelphia region due to the increased number of approved suppliers as well as the increased spend since it began in 1986 as the Buy West Philadelphia Program. Penn is committed to the continued growth of the program and the ongoing development of business relationships.
Black-owned Business Spending Trends
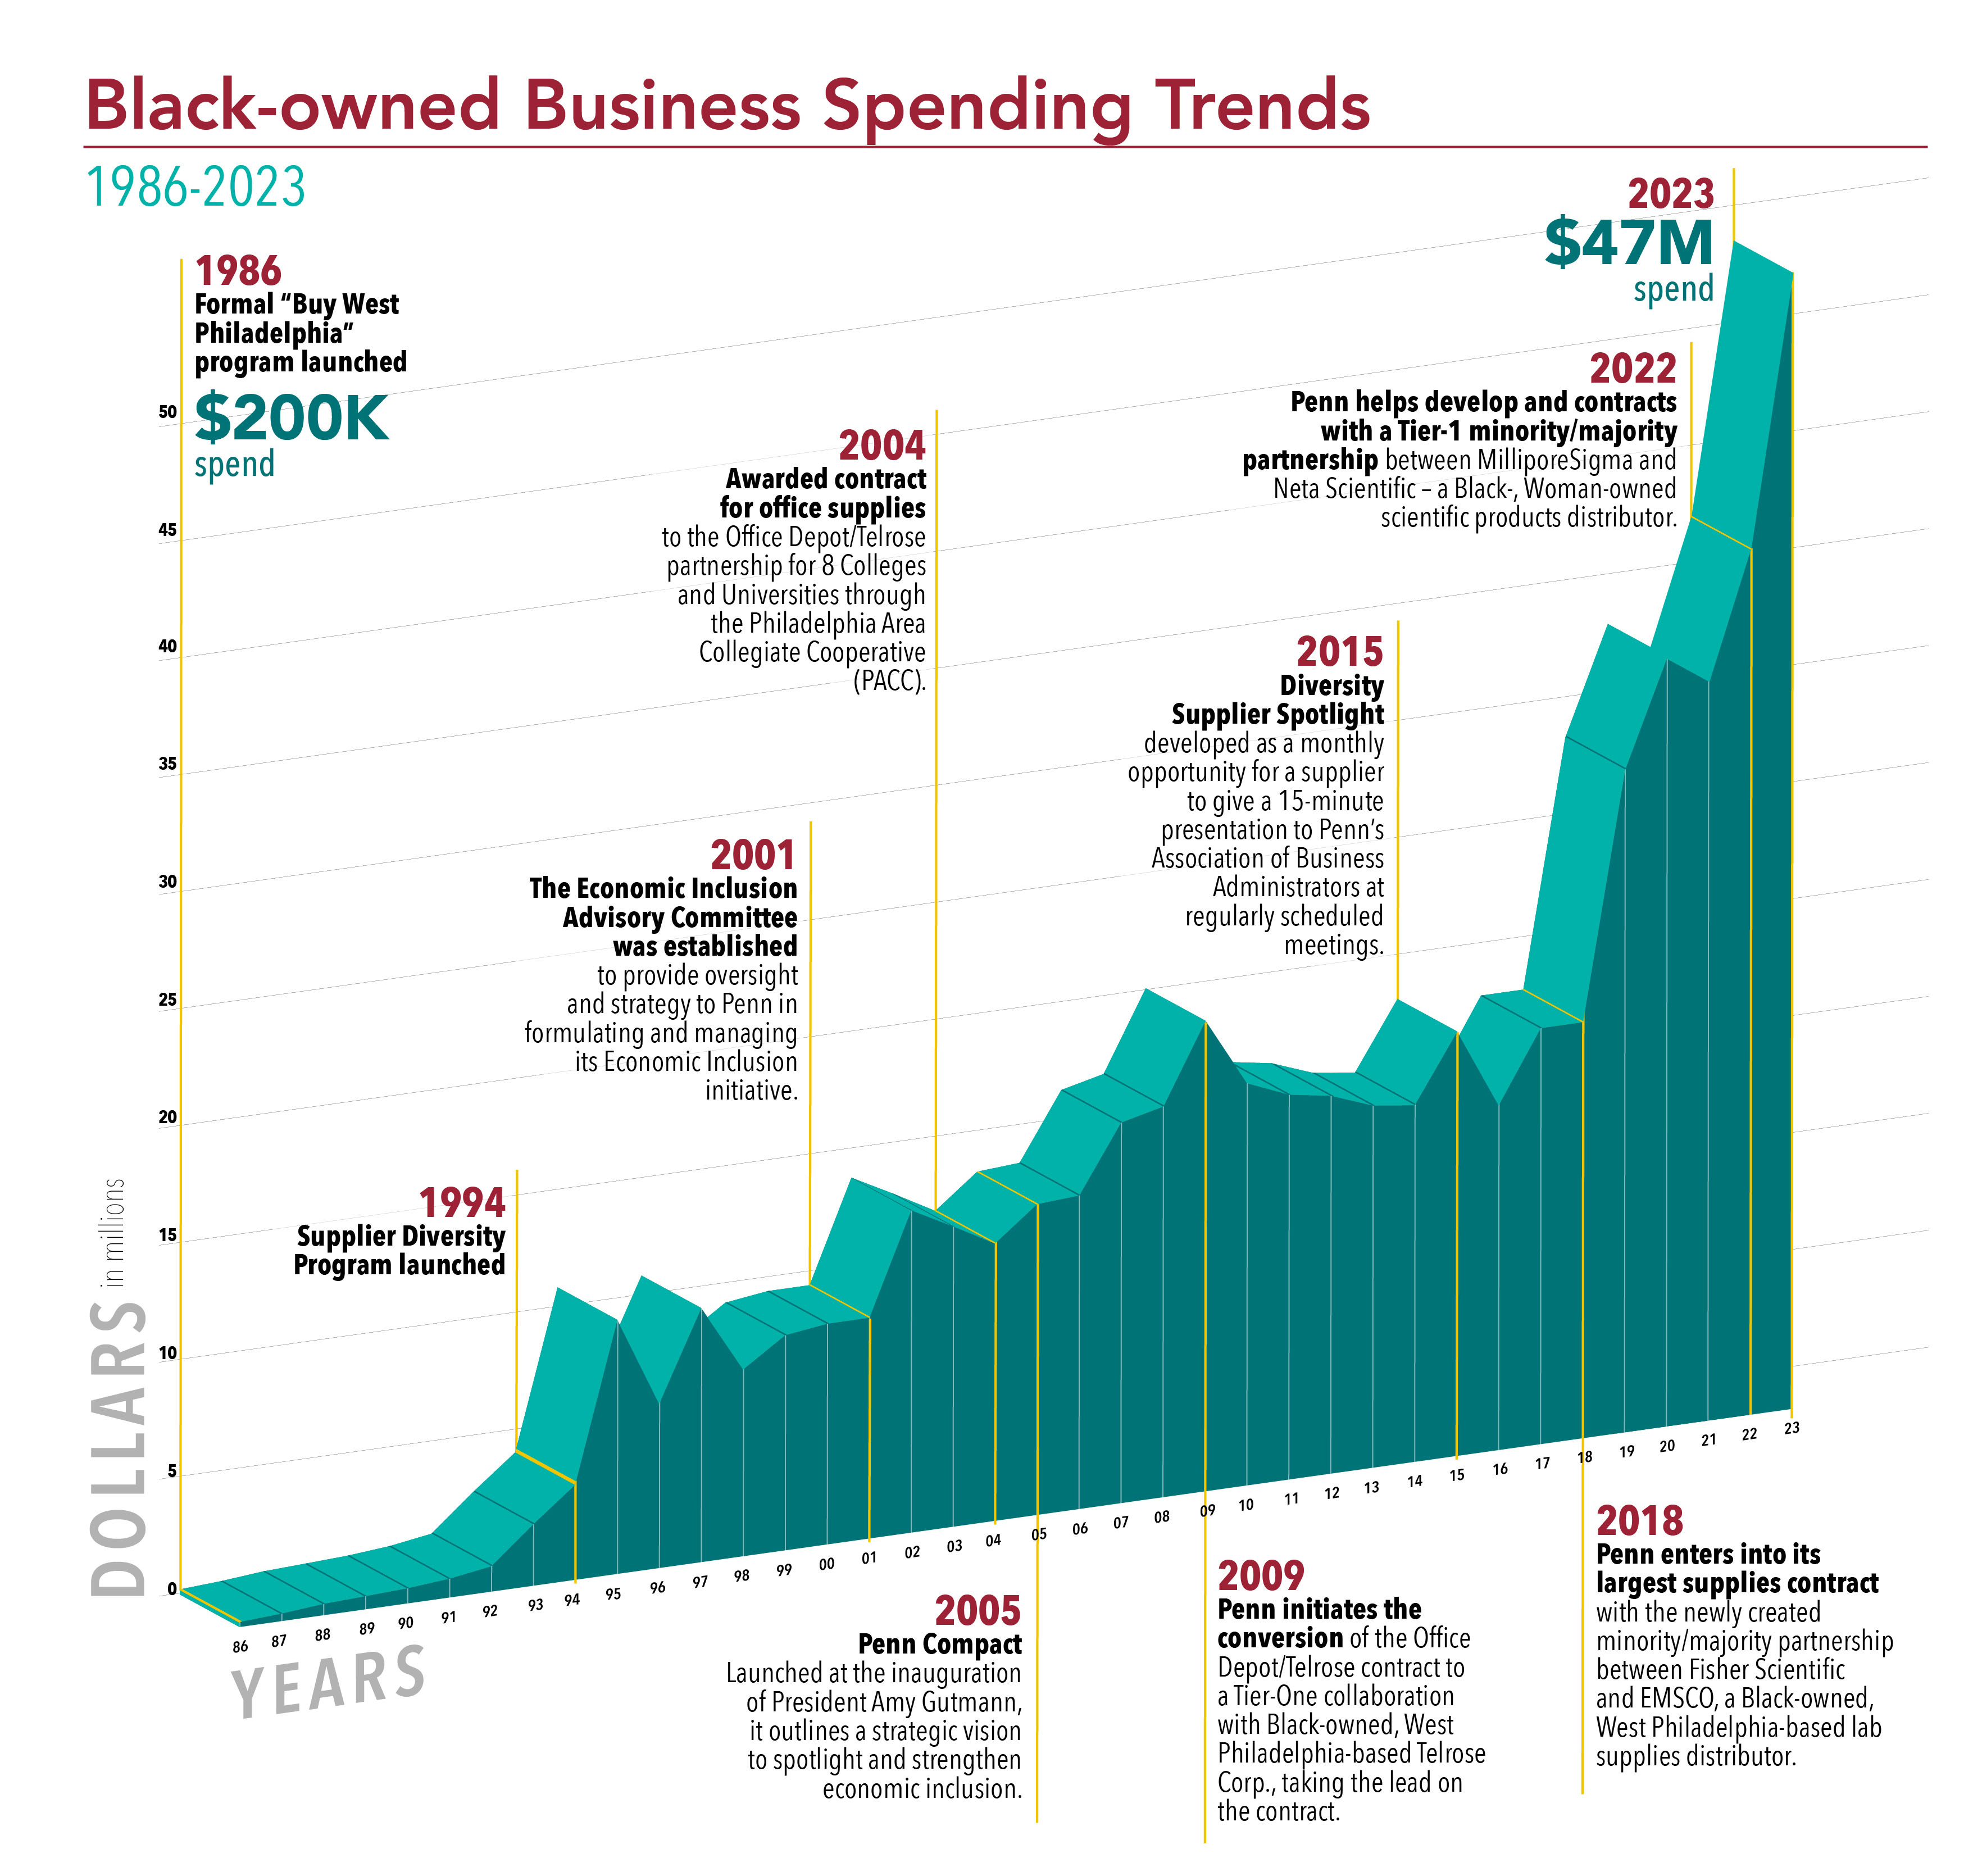
1986-2023
An area chart displays Penn's spending data for each year of a thirty-four year span.
The chart features nine historical highlights, including:
1986
Formal “Buy West Philadelphia” program launched
In this year there was a two-hundred thousand dollar spend on Black-owned businesses
1994
Supplier Diversity Program launched
2001
The Economic Inclusion Advisory Committee was established to provide oversight and strategy to Penn in formulating and managing its Economic Inclusion initiative.
2004
Awarded contract for office supplies to the Office Depot/Telrose partnership for 8 Colleges and Universities through the Philadelphia Area Collegiate Cooperative (PACC).
2005
Penn Compact Launched at the inauguration of President Amy Gutmann, it outlines a strategic vision to spotlight and strengthen economic inclusion.
2009
Penn Procurement initiates the conversion of the Office Depot/Telrose contract to a Tier-One collaboration with African American-owned, West Philadelphia-based Telrose Corp., taking the lead on the contract.
2015
Diversity Supplier Spotlight developed as a monthly opportunity for a supplier to give a 15-minute presentation to Penn’s Association of Business Administrators at regularly scheduled meetings.
2018
Penn enters into its largest supplies contract with the newly created minority/majority partnership between Fisher Scientific and EMSCO, a Black-owned, West Philadelphia-based lab supplies distributor.
2020
In this year there was a Thirty-four million dollar spend on Black-owned businesses.
The data for Black-owned Business spending for each year displayed on the area chart includes:
1986 total was 200 thousand dollars
1987 total was 300 thousand dollars
1988 total was 500 thousand dollars
1989 total was 600 thousand dollars
1990 total was 700 thousand dollars
1991 total was 900 thousand dollars
1992 total was 1.1 million dollars
1993 total was 2.7 million dollars
1994 total was 4.1 million dollars
1995 total was 11.2 million dollars
1996 total was 7.2 million dollars
1997 total was 11.2 million dollars
1998 total was 8.2 million dollars
1999 total was 9.6 million dollars
2000 total was 9.8 million dollars
2001 total was 9.8 million dollars
2002 total was 14.2 million dollars
2003 total was 13.1 million dollars
2004 total was 12.1 million dollars
2005 total was 13.8 million dollars
2006 total was 13.9 million dollars
2007 total was 16.9 million dollars
2008 total was 17.2 million dollars
2009 total was 21.8 million dollars
2010 total was 18.8 million dollars
2011 total was 18.0 million dollars
2012 total was 17.7 million dollars
2013 total was 17.0 million dollars
2014 total was 16.7 million dollars
2015 total was 19.7 million dollars
2016 total was 16.2 million dollars
2017 total was 19.4 million dollars
2018 total was 19.4 million dollars
2019 total was 29.2 million dollars
2020 total was 34.4 million dollars
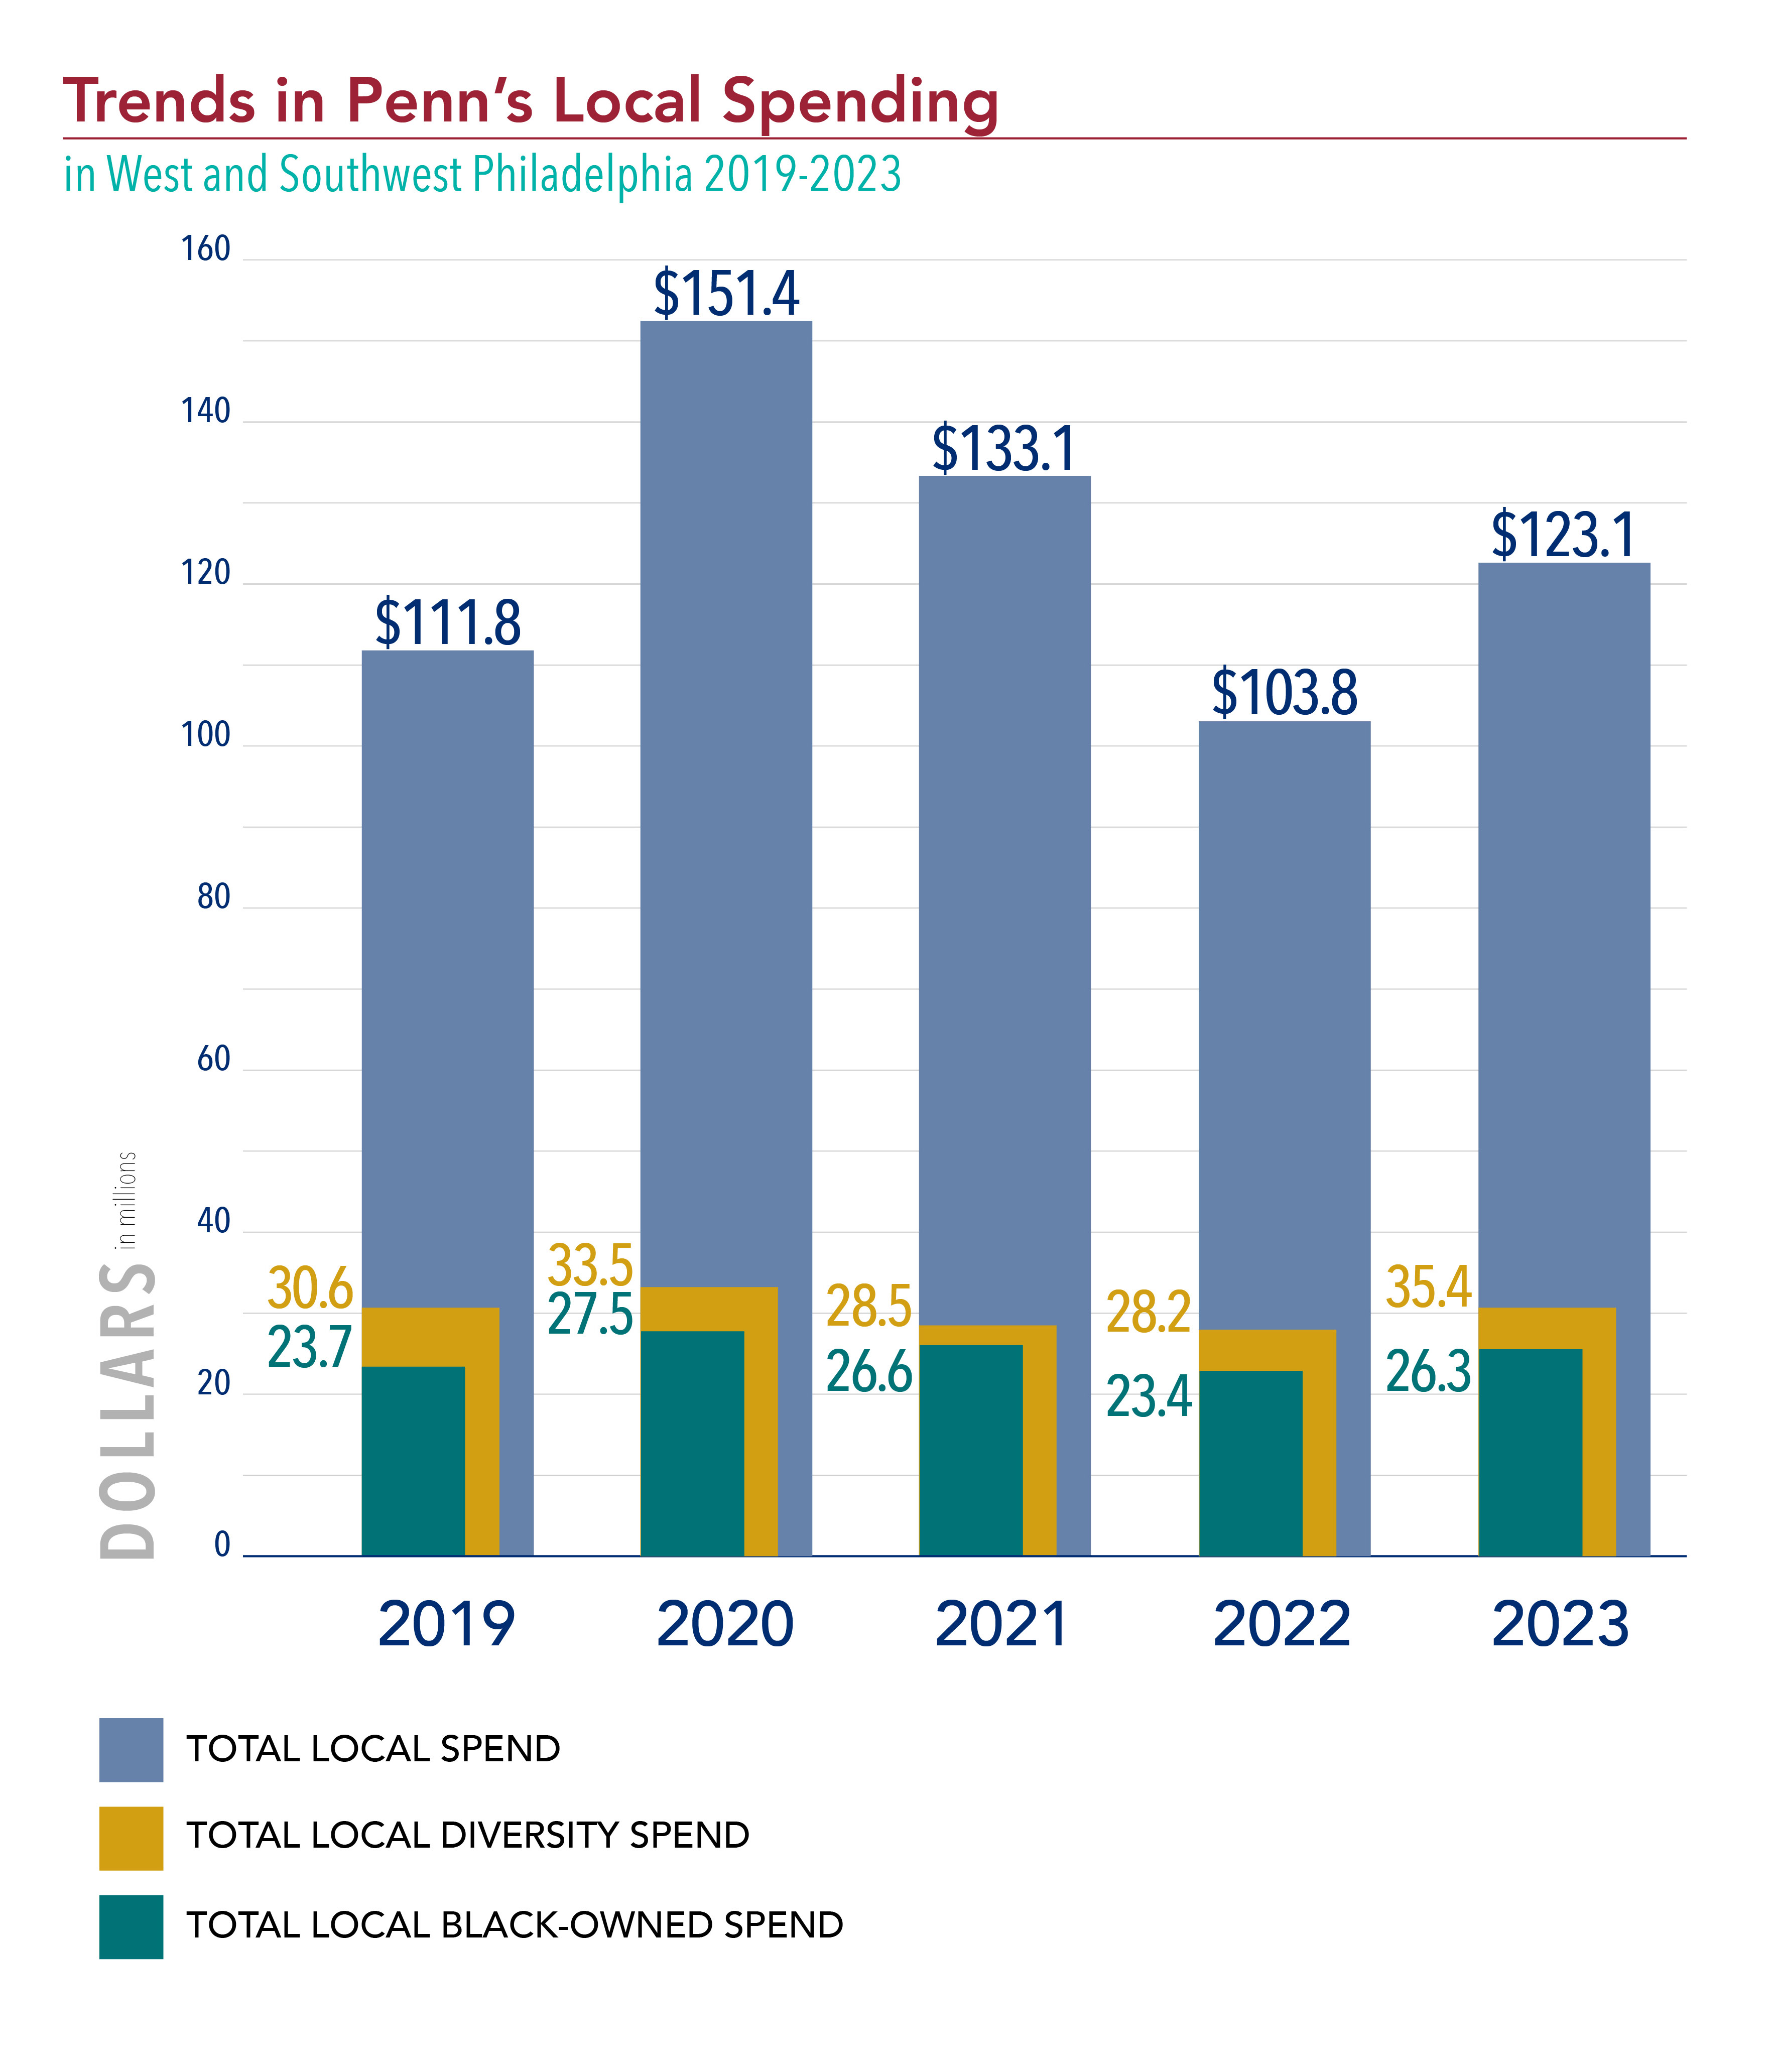
Trends in Penn’s Local Spending
In West and Southwest Philadelphia 2016-2023
A bar chart displays Penn's spending data with local businesses during a five year span from 2016 through 2020.
The chart features total spending data broken down into three categories:
The total Local Black-owned Business spend
Total Local Diversity Business spend
And
Total Local Business spend
The data for spending during each year displayed on the bar chart includes:
In 2016, 5.2 million dollars was spent with Local Black-owned businesses,
21.6 million dollars was spent with Local Diversity businesses,
And
$137.6 million dollars was spent with Local businesses in West and Southwest Philadelphia.
In 2017, 13.1 million dollars was spent with Local Black-owned businesses,
20.9 million dollars was spent with Local Diversity businesses,
and
$135.1 million dollars was spent with Local businesses in West and Southwest Philadelphia.
In 2018, 12.6 million dollars was spent with Local Black-owned businesses,
19.1 million dollars was spent with Local Diversity businesses,
and
$88.3 million dollars was spent with Local businesses in West and Southwest Philadelphia.
In 2019, 23.7 million dollars was spent with Local Black-owned businesses,
30.6 million dollars was spent with Local Diversity businesses,
and
$111.8 million dollars was spent with Local businesses in West and Southwest Philadelphia.
In 2020, 27.5 million dollars was spent with Local Black-owned businesses,
33.5 million dollars was spent with Local Diversity businesses,
and
$151.4 million dollars was spent with Local businesses in West and Southwest Philadelphia.
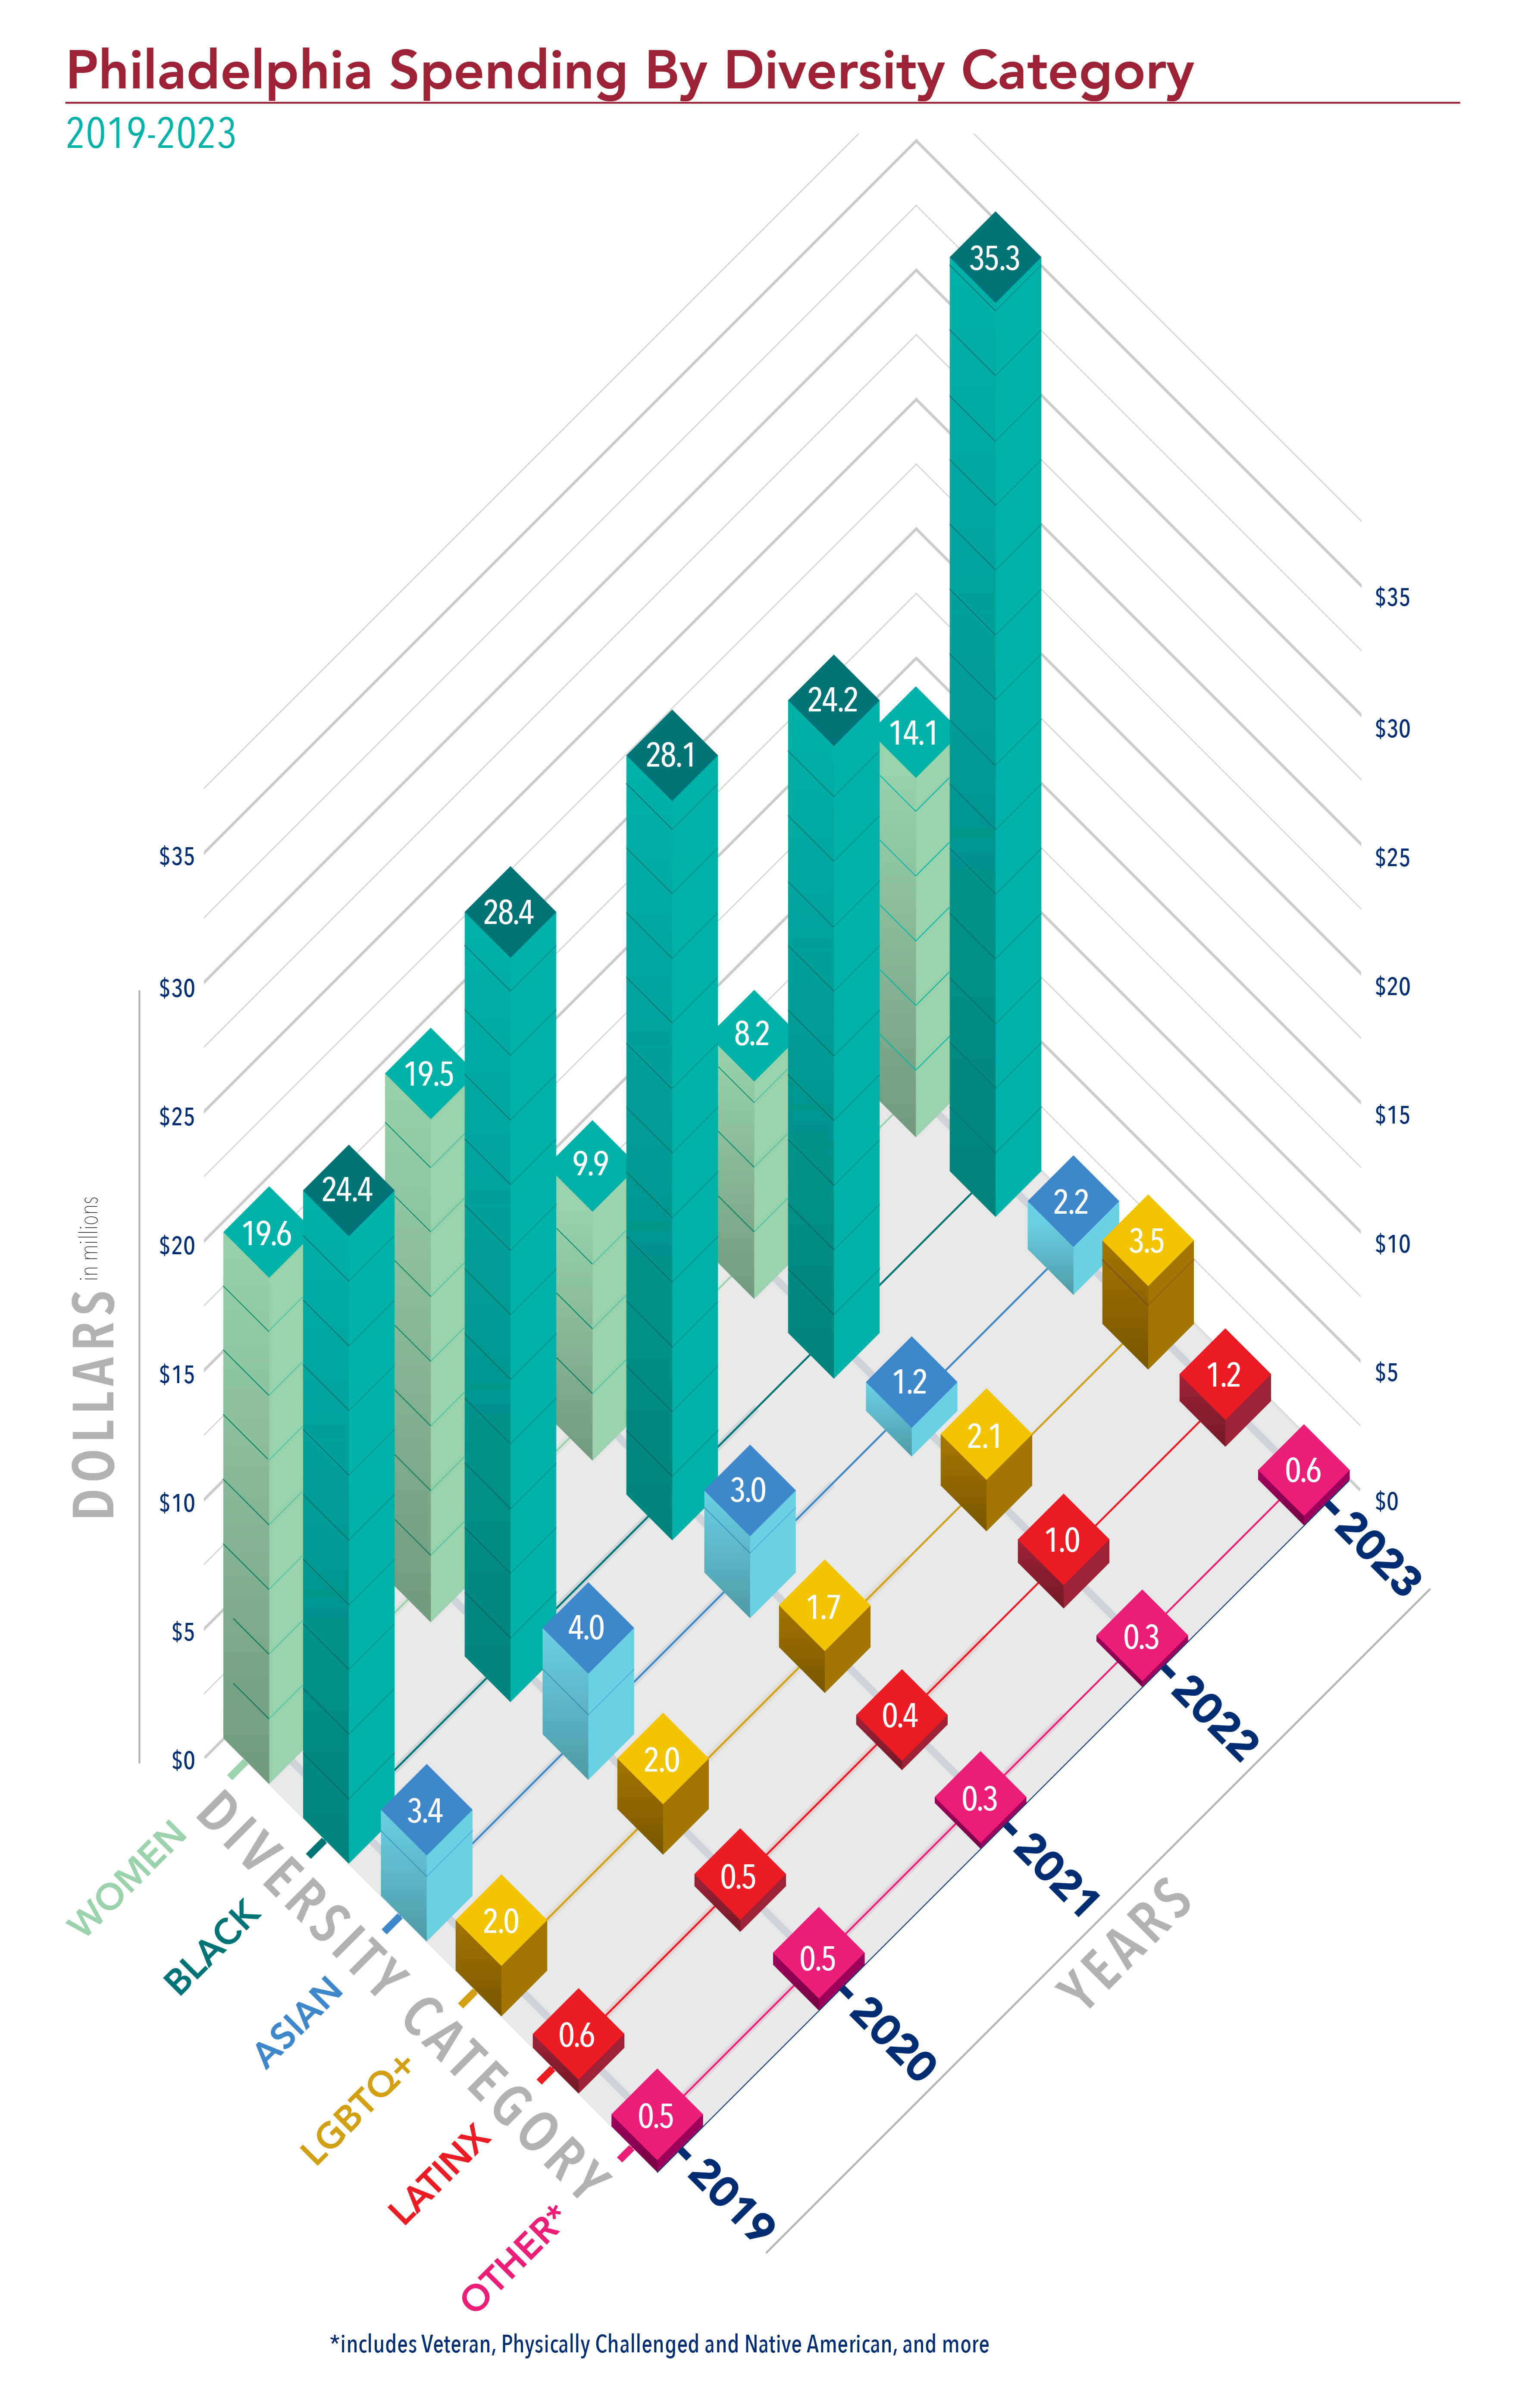
Philadelphia Spending By Diversity Category
2016-2022
A bar chart displays Penn's spending data with Philadelphia city-wide Diversity businesses during a five year span from 2016 through 2020.
The chart features total spending data broken down into six diversity categories:
The total Women-owned Business spend
Total Black-owned Business spend
Total Asian-owned Business spend
Total LGBTQ+ owned Business spend
Total LatinX-owned Business spend
and
A total spend for businesses in Other miscellaneous diversity categories including Veteran, Physically Challenged, Native American, and more.
The data for spending during each year displayed on the bar chart includes:
In 2016,
513 thousand dollars was spent with Other miscellaneous diversity businesses.
557 thousand dollars was spent with LatinX-owned businesses.
573 thousand dollars was spent with LGBTQ+ owned businesses.
2.6 million dollars was spent with Asian-owned businesses.
5.5 million dollars was spent with Black-owned businesses.
22 million dollars was spent with Women-owned businesses.
In 2017,
541 thousand dollars was spent with Other miscellaneous diversity businesses.
345 thousand dollars was spent with LatinX-owned businesses.
476 thousand dollars was spent with LGBTQ+ owned businesses.
3.4 million dollars was spent with Asian-owned businesses.
14 million dollars was spent with Black-owned businesses.
22 million dollars was spent with Women-owned businesses.
In 2018,
451 thousand dollars was spent with Other miscellaneous diversity businesses.
616 thousand dollars was spent with LatinX-owned businesses.
376 thousand dollars was spent with LGBTQ+ owned businesses.
2.9 million dollars was spent with Asian-owned businesses.
14.5 million dollars was spent with Black-owned businesses.
19.9 million dollars was spent with Women-owned businesses.
In 2019,
534 thousand dollars was spent with Other miscellaneous diversity businesses.
670 thousand dollars was spent with LatinX-owned businesses.
2 million dollars was spent with LGBTQ+ owned businesses.
3.4 million dollars was spent with Asian-owned businesses.
24.4 million dollars was spent with Black-owned businesses.
19.6 million dollars was spent with Women-owned businesses.
In 2020,
543 thousand dollars was spent with Other miscellaneous diversity businesses.
532 thousand dollars was spent with LatinX-owned businesses.
2 million dollars was spent with LGBTQ+ owned businesses.
4 million dollars was spent with Asian-owned businesses.
28.4 million dollars was spent with Black-owned businesses.
19.5 million dollars was spent with Women-owned businesses.